Misty Cove Wines Vineyard – October 2020
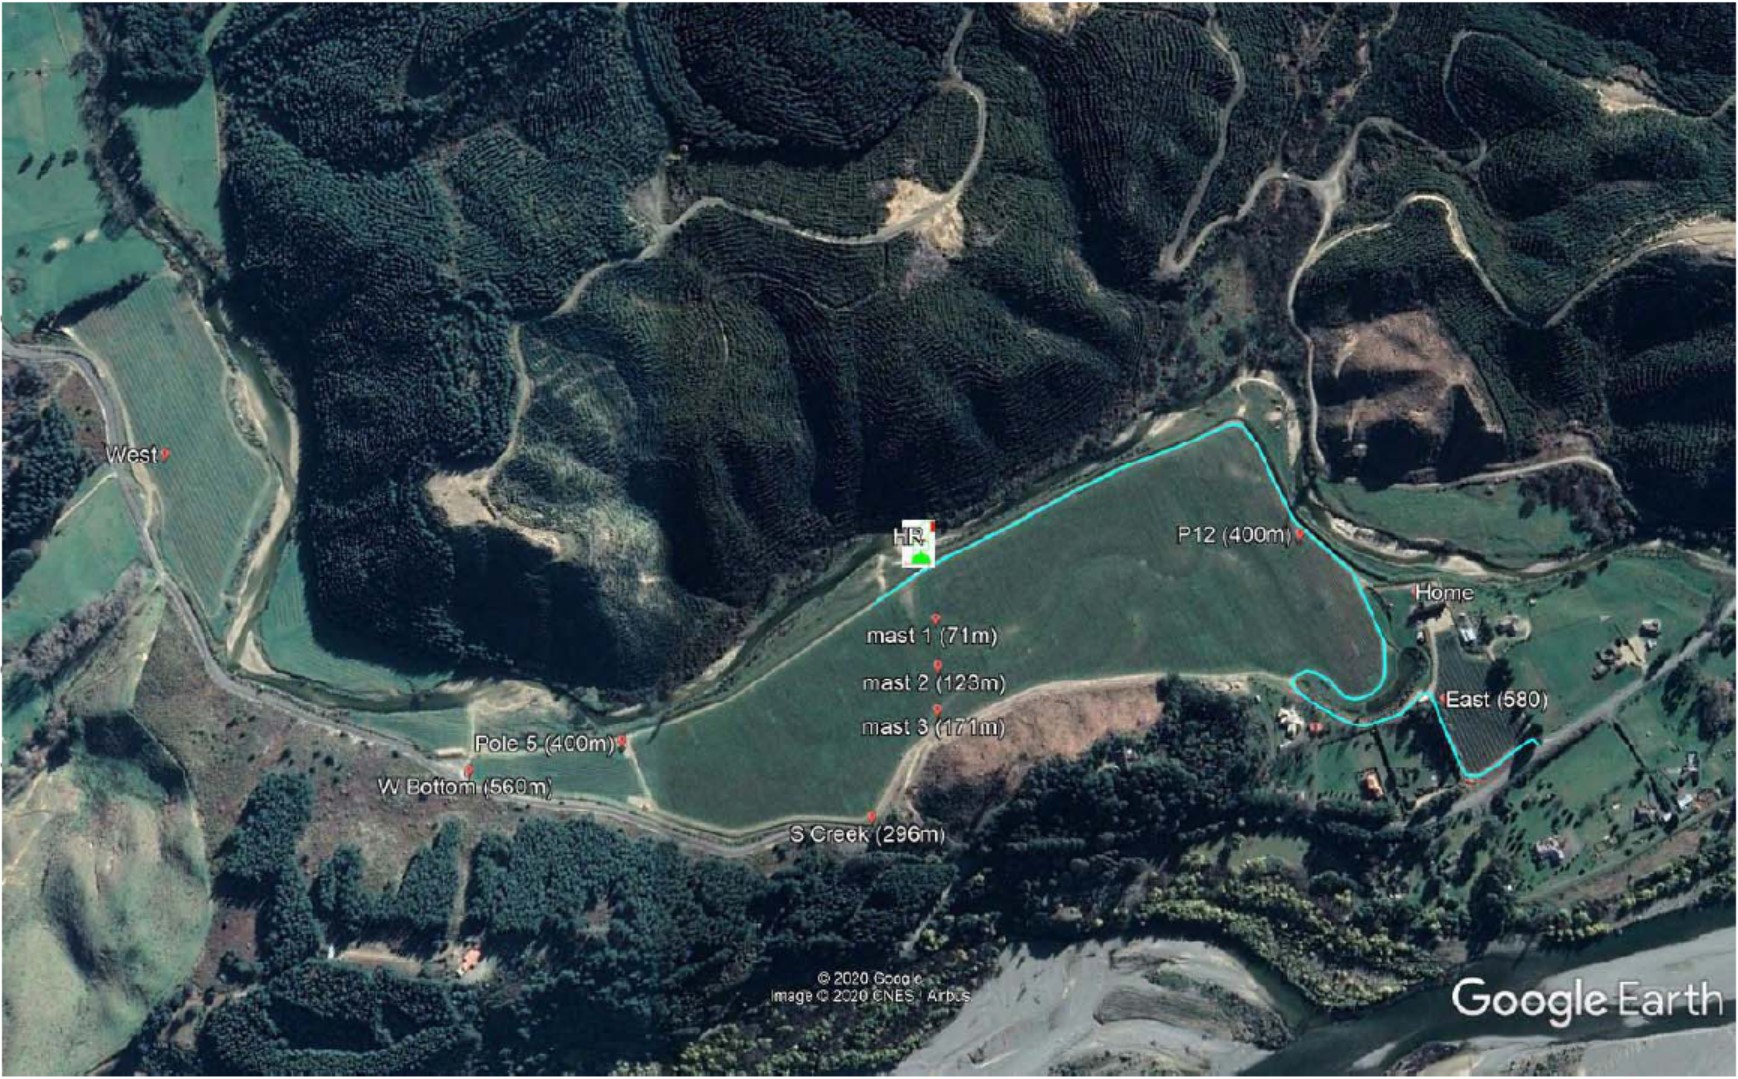
Misty Cove Wines has a very challenging vineyard located between large hills at 420 Northbank Rd, close by the lower Wairau River in Marlborough. Because of its location it often does not have a useful inversion layer and the block is a kilometre long ranging in width from just 50m up to 310m at the eastern end.
We did have frosts in Marlborough this spring so it was an ideal opportunity to get another season with reliable data, in a challenging situation, to back up the data we have been collecting over the last 5 years.
We had a cool night on the 9th/10th October where we were able to confirm that all of the systems were working correctly. We had some warm weather that encouraged the vine growth to get fully underway and we had a forecast of a ‐2°C frost for the night of the 15/16th October.
We ran Heat Ranger from 10:30p.m. until 8:15a.m. with no crop damage across the block.
Key Points
Irregular vineyards offer a challenge for frost protection, especially when it comes to evaluating a machine because of the inherent variability and range of temperatures across the site. In this case the temperature differences are significant and do not appear to have a clear pattern apart from the fact that the West site up the valley is almost always the coldest, West Bottom tends to be the next coldest and the South Creek location is usually the warmest.
- Heat Ranger’s objective is to protect crops by keeping the fruiting zone above damaging temperatures in frost events as cold as ‐3°C. While temperatures can drop, the new shoots can survive brief periods as low as -2°C provided that plants are not subjected to these low temperatures for more than about 10 to 15 minutes. This is consistent with the results we had from Fiddlers Green 5 years ago.
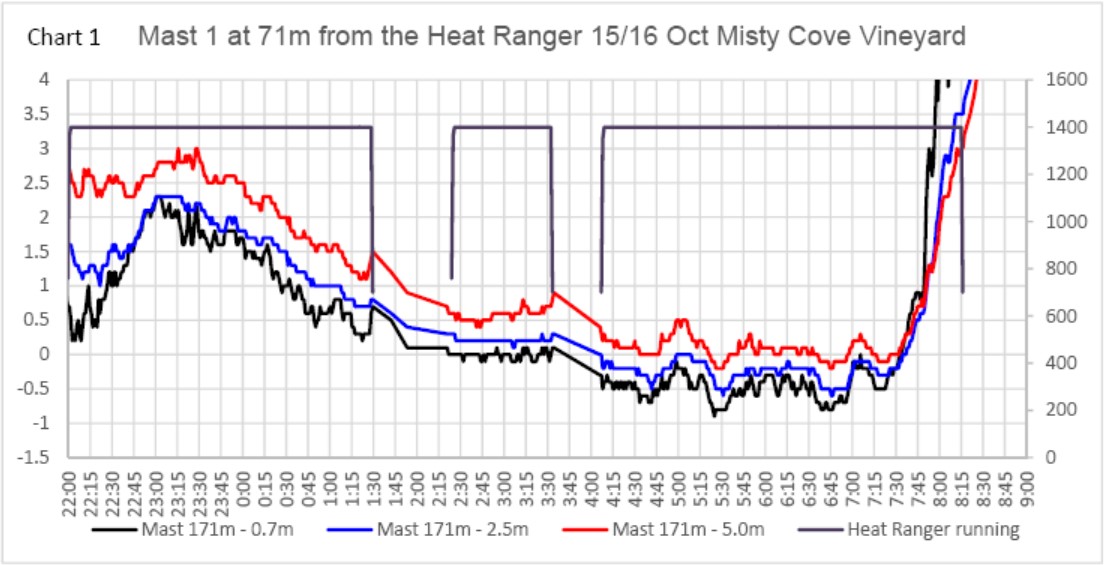
In the 16th October event the temperature levels peak as the machine rotates past the masts and the temperature difference between the top and bottom of the mast gradually reduces (0.7 to 5m above ground level).
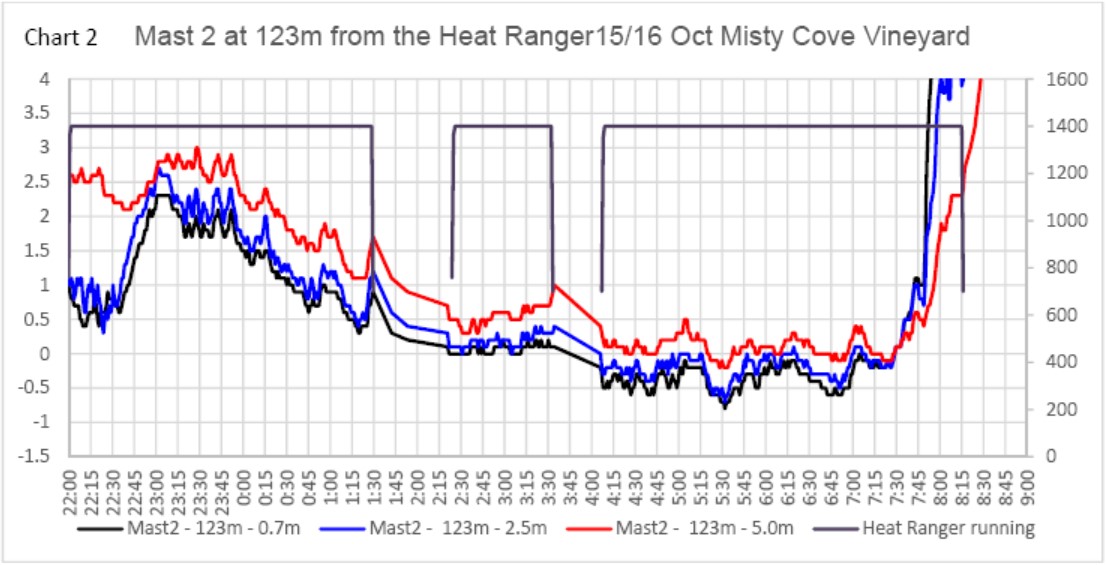
The key point in this event was that the periods below ‐0.5°C were quite brief with the longest continuous period being 16 minutes at mast 2 and the total time below ‐0.5°C was 8 minutes for mast 1, 31 minutes for mast 2 and 3 minutes for mast 3.
The subsequent ground check of the site for any damage is what really tells the important story, and it confirmed what the data was telling us.
- It would appear that despite the fact that the machine is located off to one side from the vineyard and is applying a significant amount of heat to the northern hillside it was able to apply a significant amount to the target area and provide protection with air temperatures above zero at cordon height maintained for most of the time.
15 ‐ 16th October 2020
Event Description
This event was predicted to go below ‐1°C at Blenheim and below ‐2°C at Misty Cove. The machine is normally set to go through a pre-start procedure at 5o to warm up the engine and to restart during the predicted event when the engine temperature gets back down to 10°C, unless the frost event has already triggered the machine. From 21:30 on the 15th temperatures were falling rapidly so we decided to start the machine at 22:00 and as temperatures fell through 2o but the wind came up and the temp decline slowed and began to fall again round 23:00.
At 1:30 the temperatures on the Harvest sensors picked up by about 0.5°C and the machine was shut down for 55 minutes. In the first half hour the temperatures dropped about 0.7°C and Harvest sites were going in different directions. The West Bottom temperatures typically run at 1°C or more lower than the Southern Creek site and relatively close to the temperatures in the centre of the vineyard but that changed with Southern Creek falling while West bottom was steady, so the machine was turned on again at 2:26 which halted the decline in the centre of the block. At 3:33 the West temp was rising and we shut down for another 40 minutes and restarted at 4:09 as the West temperatures started to fall again through until 8:30. The Harvest sensors generally trended downwards over this period and the central Vineyard area was either stable or trending upwards with the lowest temperature being ‐0.7°C for a period of 7 minutes at 5:30.
With the gas that we had used in commissioning the machine and the run on the 9th October, it was important that we had enough gas to see us through the 4:00 to 7:30 period as this tends to be the coldest period in a frost event (Full Gas Tanks would have meant continuous operation).
Sensors
The mast sensors are programmed to provide temperature readings every minute when the machine is running but are not at fixed time intervals when the machine is stopped. The rotation speed for the turret was just under 4 minutes. When looking at the temperatures on the masts, the sensor at 0.7m shows temperature spikes at between 3 ‐ 4 times in each 15 minute segment with the spikes being more pronounced in the closer masts. The low spikes show the cooling effect in the time gap before the warm air returns. Charts 1 to 3 show this quite clearly.
Results
The Heat Ranger machine tends to have a range of between 200 to 250m but this can vary according to wind and topography. The location of the machine was dictated by the need to stay on the driveway for gas refuelling access, but for a long term location it would be located within the Vine area so that all of the heat and warm air is applied to the vineyard area. Despite this, a significant area was protected and the results are consistent with a 250m radius of influence which on a flat continuous site is of the order of 20 ha.
The South Creek Harvest monitor was located 296 m from the machine and there appears to have been some influence out to that sensor where it held the temp above between 7:00 and 8:00 while the West sensor fell by 0.5°C in the same period.
When you view the three masts with the sensors at 0.7m, 2.5m and 5m, the spread between the top and bottom sensors was approximately 2°C at 22:00 and 12 hours later it had closed to 0.4°C at 8:00.
When the machine was turned off there was no warm air replenishment and the temperatures dropped about 0.5°C during each of those intervals and stabilized when the machine came back on again.
Had we run it without breaks, it is unlikely that the temperatures at cordon height would have fallen below 0°C at all but we had lost some gas during the week and I was unsure about the supply and did not want to run out of gas before the 5:00 to 7:00 coldest period.
The charts from the masts tell the story with the Heat Ranger located in the coldest area adjacent to the stream and the spikes of warm air are clearly obvious at the first two masts and less so at mast 3, but they can still be seen. Over the period the warmed area quietly made ground on all of the other masts and it would appear that some of that warm air may have reached as far as the Southern Creek in Chart 5. Given that we lost about 30% of the heat as waste on the northern hill side this is a pretty good result and would warrant the expense of locating the machine down row 183 which would then enable the machine to increase its rotation speed from 3minute 45 seconds up to 3 minutes which reduces the trough following each rotation.
At 10p.m. on the 15th the coldest area was at masts 1 and 2 which were 1°C colder than the upstream West sensor and 2°C colder than any of the other sites shown in chart 4. The fact that we had a temperature as low as 1°C at 10p.m. meant that it was a long event and with full tanks I would have run it continuously to avoid the two drop off periods.
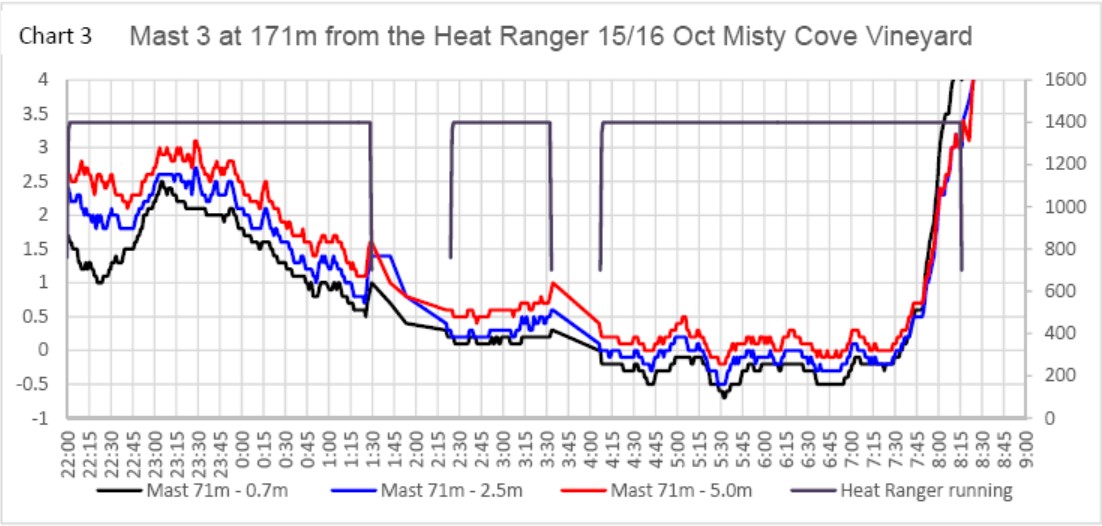
Chart 3 is still showing slight peaks at 170 m but when the warm air is at this distance, the air spread in the plume is much wider and slower. Beyond 200m the replenishment is less per pass but the effective plume coverage is longer in time because it takes about 2 minutes to pass over a sensor that far out.
Looking at the periods below zero the time periods in minutes are relatively short
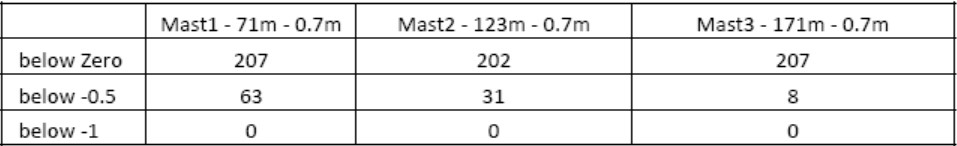
The maximum continuous period below ‐0.5°C was just 23 minutes on mast 1
Chart 4 below, shows the temperatures during the period for the Harvest masts and apart from the West station, all the rest were 2.5 to 3°C warmer than mast 1 at 22:00 on the night of the 15th. When the Heat Ranger was running the heated air brought the central vineyard temperatures up, reducing that difference during the night as the warm air slowed the heat loss from the central area, without changing the loss rate from the more distant masts.
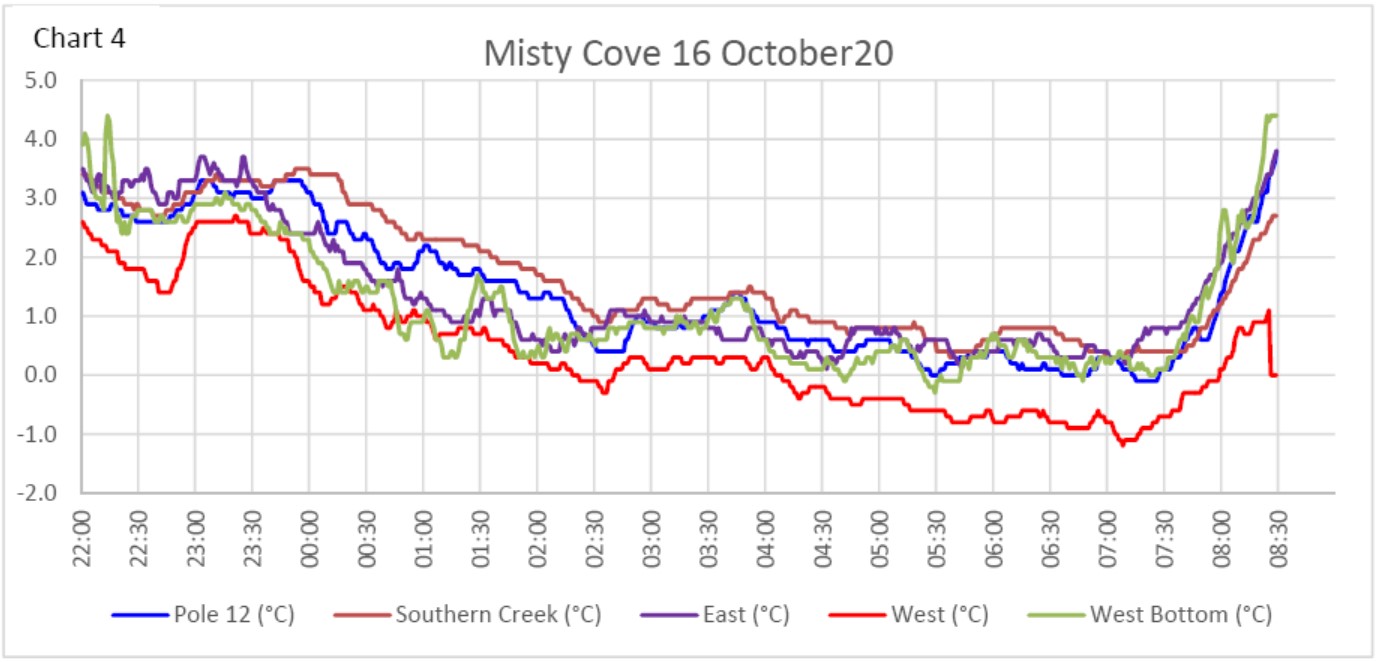
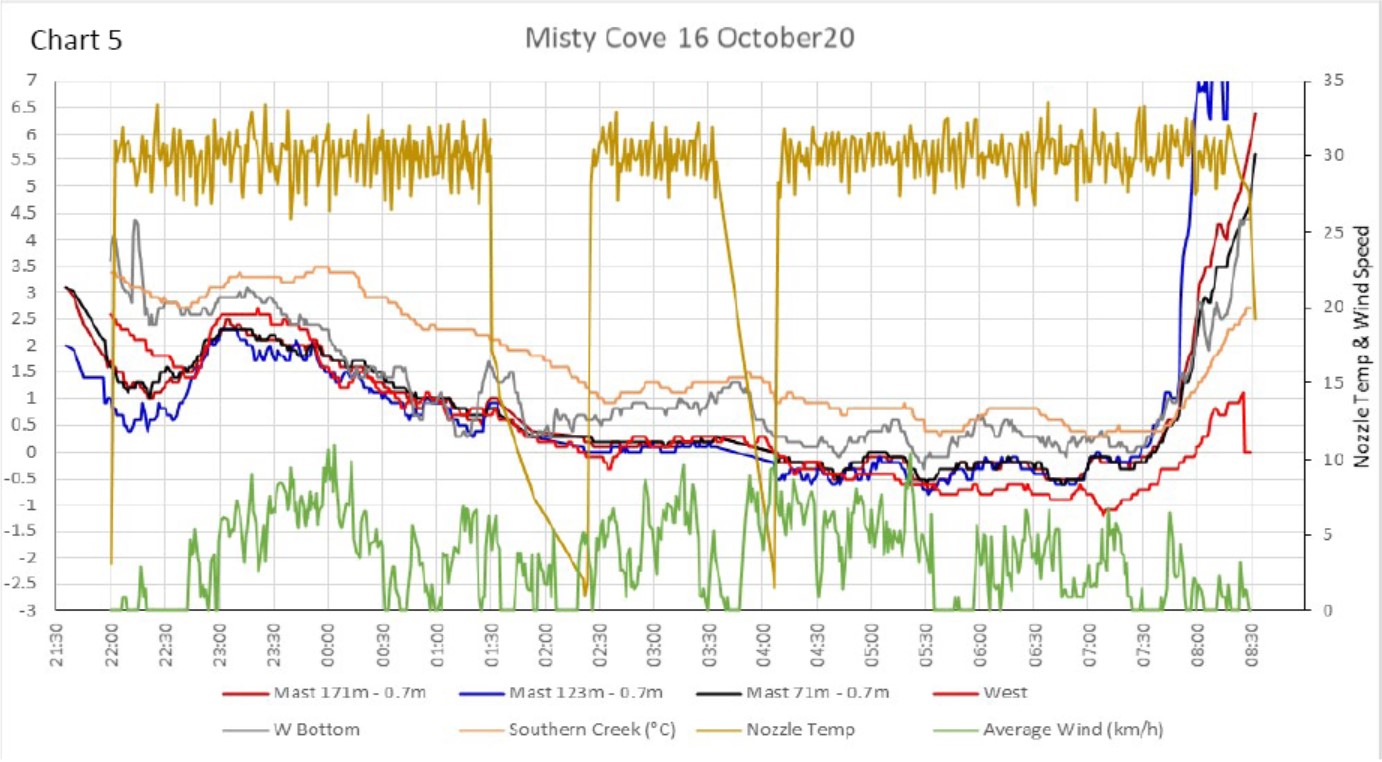
Chart 5 overlays all the sensors at 0.7m above the ground from masts 1, 2 and 3 with the Harvest sensors. The heated area is tracking warmer than the West site from about 1:30 when the machine was turned off but dropped below again and recovered when the machine came back on. This was repeated with the second shut down and subsequent restart. We did not make a lot of ground on closing the gap on the southern creek temperature until about 6:45 but I believe that this sensor was getting some wash from the Heat Ranger even though it was about 300m away which meant that it was getting some of the added heat and as a result, stayed warmer. This is in contrast to the West site which is out of range and temperatures dropped more than 0.5°C below the Heat Ranger area having started 1.5°C warmer at 22:00.
This chart also shows a plot of the Nozzle temperature and this varies between 29 and 31°C.