
Parkburn Vineyard 28th September and 13th October 2018
The machine has been relocated from Lake View Cherries to Parkburn Vineyard where there is no frost protection other than helicopters.
Key Points
Undulating vineyards offer a challenge for frost protection, especially when it comes to trialing a machine because of the inherent variability and range of temperatures within the site.
- Heat Ranger’s objective is to protect crops by keeping the fruiting zone above damaging temperatures in frost events as cold as -3oC. While temperatures can drop the new shoots can survive brief periods as low as 2°C provided that plants are not subjected to these low temperatures for more than about 10 to 15 minutes.
- The 13th October frost event was a major for the district with limited inversion layers in many places. In this event the Heat Ranger gas bottle warming ducting had been displaced so the engine exhaust heat was only partly supplying the gas bottles and their temperature was not maintained, which meant that the Heat Ranger nozzle temperatures progressively dropped and the burner turned off and on in the later stages of the frost event. Despite this there was enough heat to provide protection for the bulk of the area and very little loss was recorded from the young buds, in what was regarded as a severe frost.
- The level of crop protection performance was consistent with earlier results that we had achieved at Fiddlers Green in Waipara.
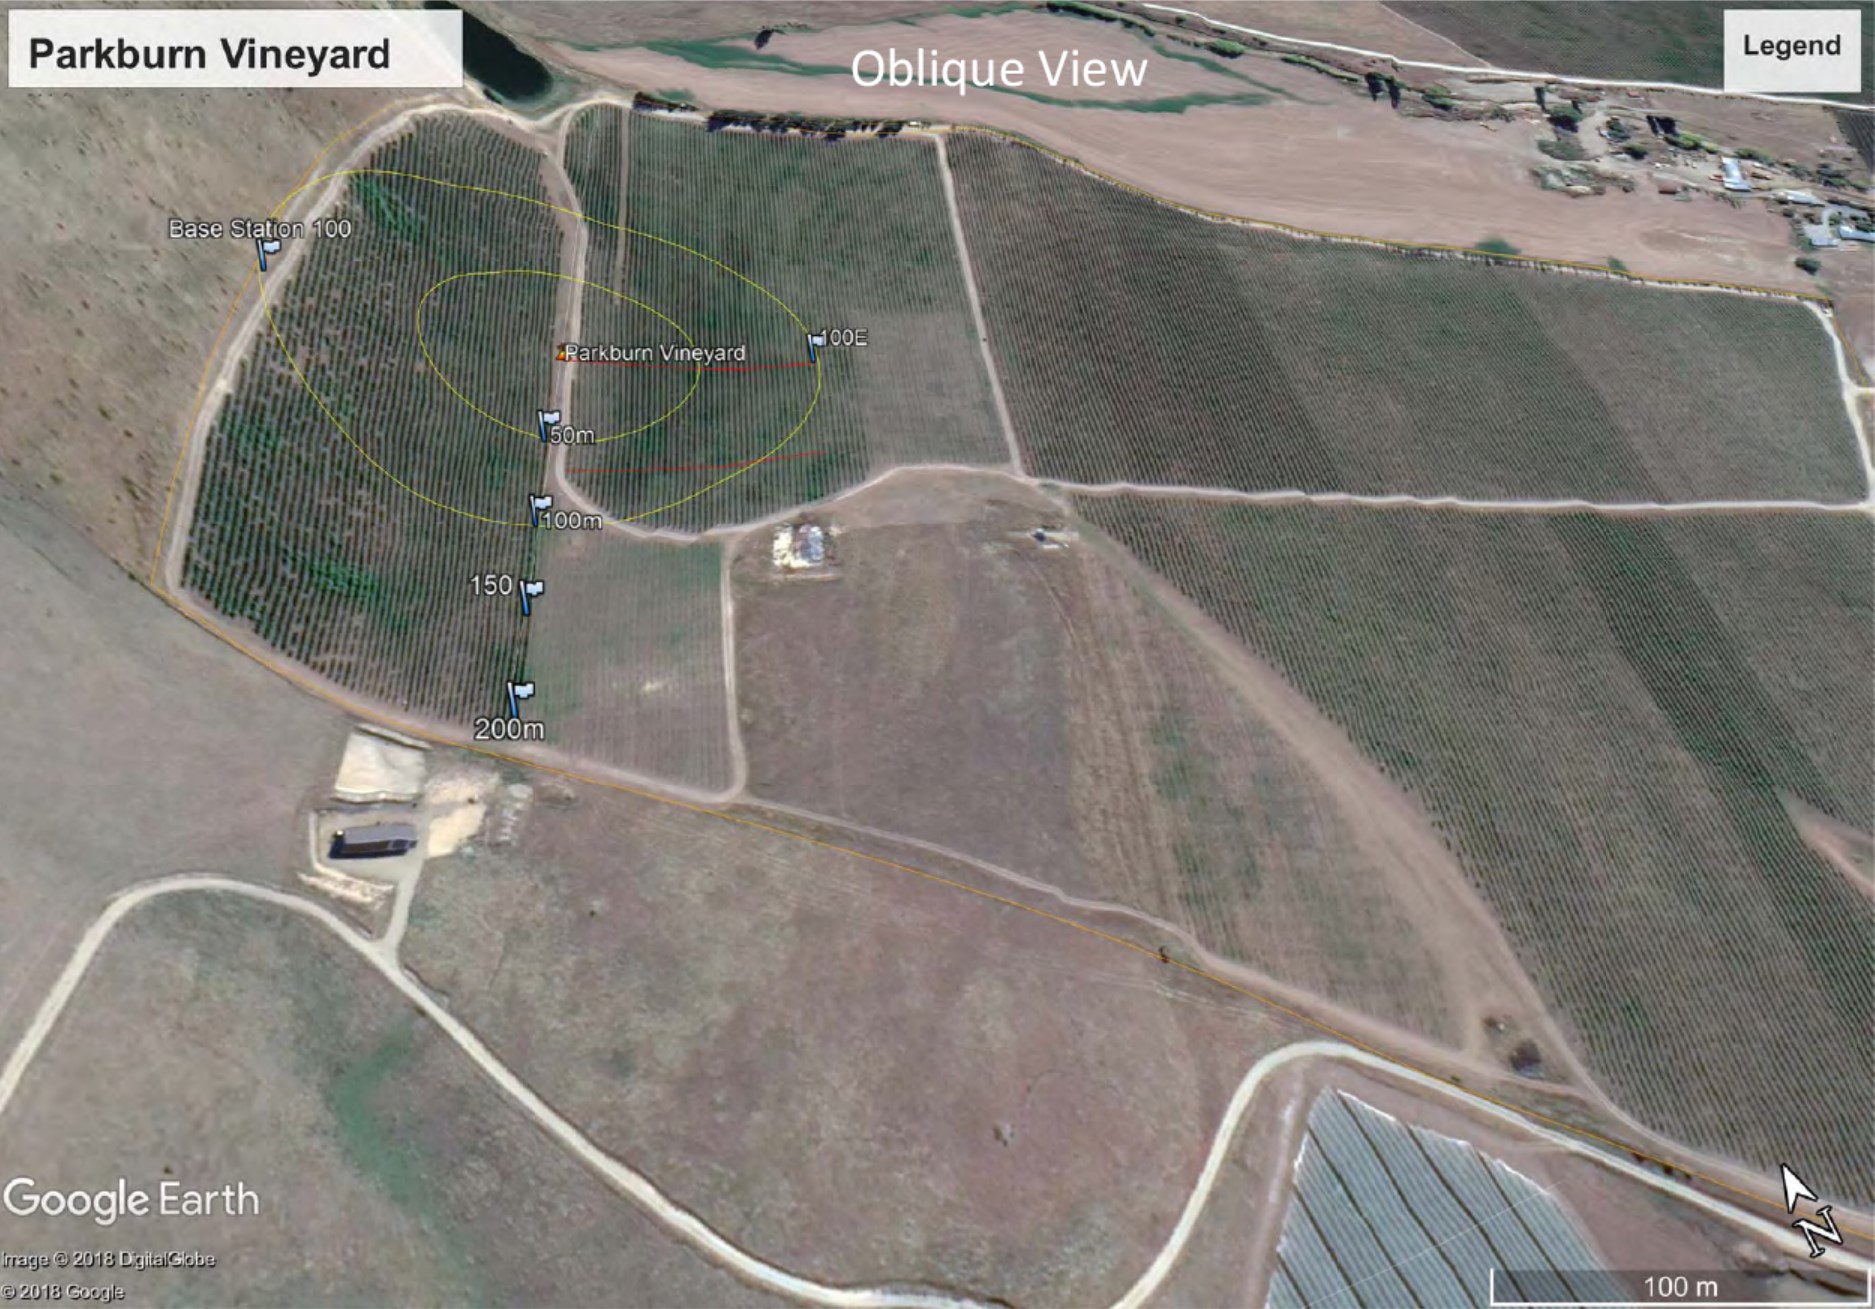
- Because of Heat Ranger’s mobility it can be evaluated and moved to get the optimum location relative to the site conditions. In light of the experience gained at Parkburn we would recommend moving it about 80m to the east and with the machine approximately level.
- With such a large circle of influence it is difficult to find adjacent unaffected monitoring sites to act as reference points for our vineyard testing.
28th September 2018
Initially we intended to run the machine for an hour in the first frost to evaluate its performance as there was no available control site or wind data. While it is possible to look up nearby stations such as Lake Terrace,
they are all using wind machines for their own frost protection so the temperature and wind data is not useful.
Brett rang on Thursday 27th to see if we would run the machine for the duration of the first frost event predicted for the following Friday morning because he had bud break and leaf shoots were showing.
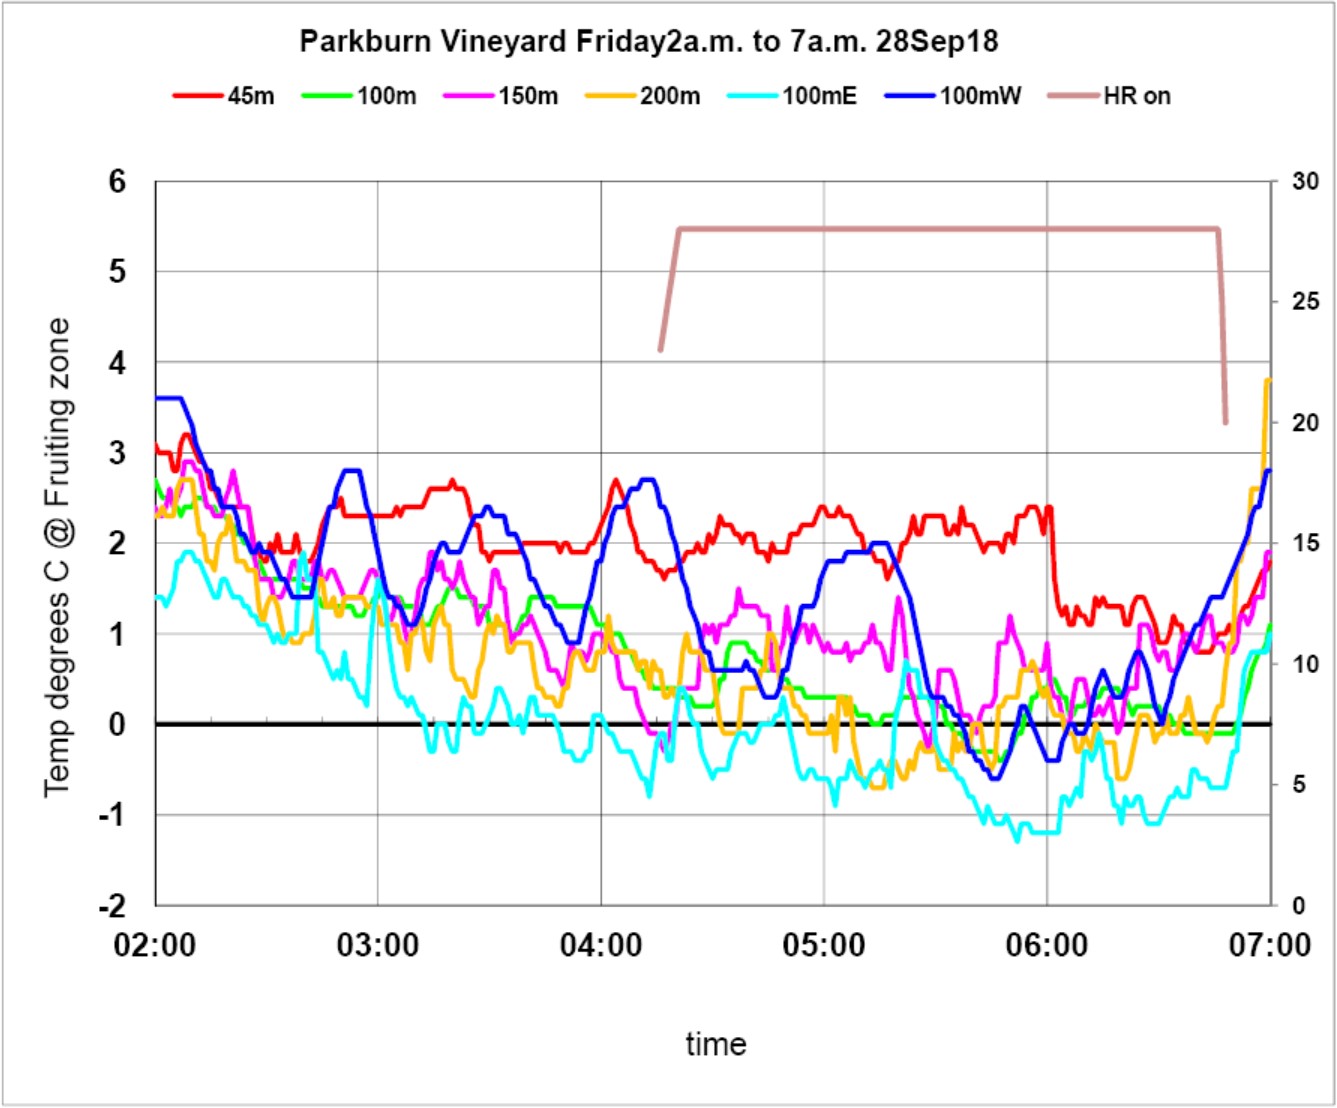
The machine started automatically and the burner lit at 4:17a.m. and was turned off at 6:47a.m.
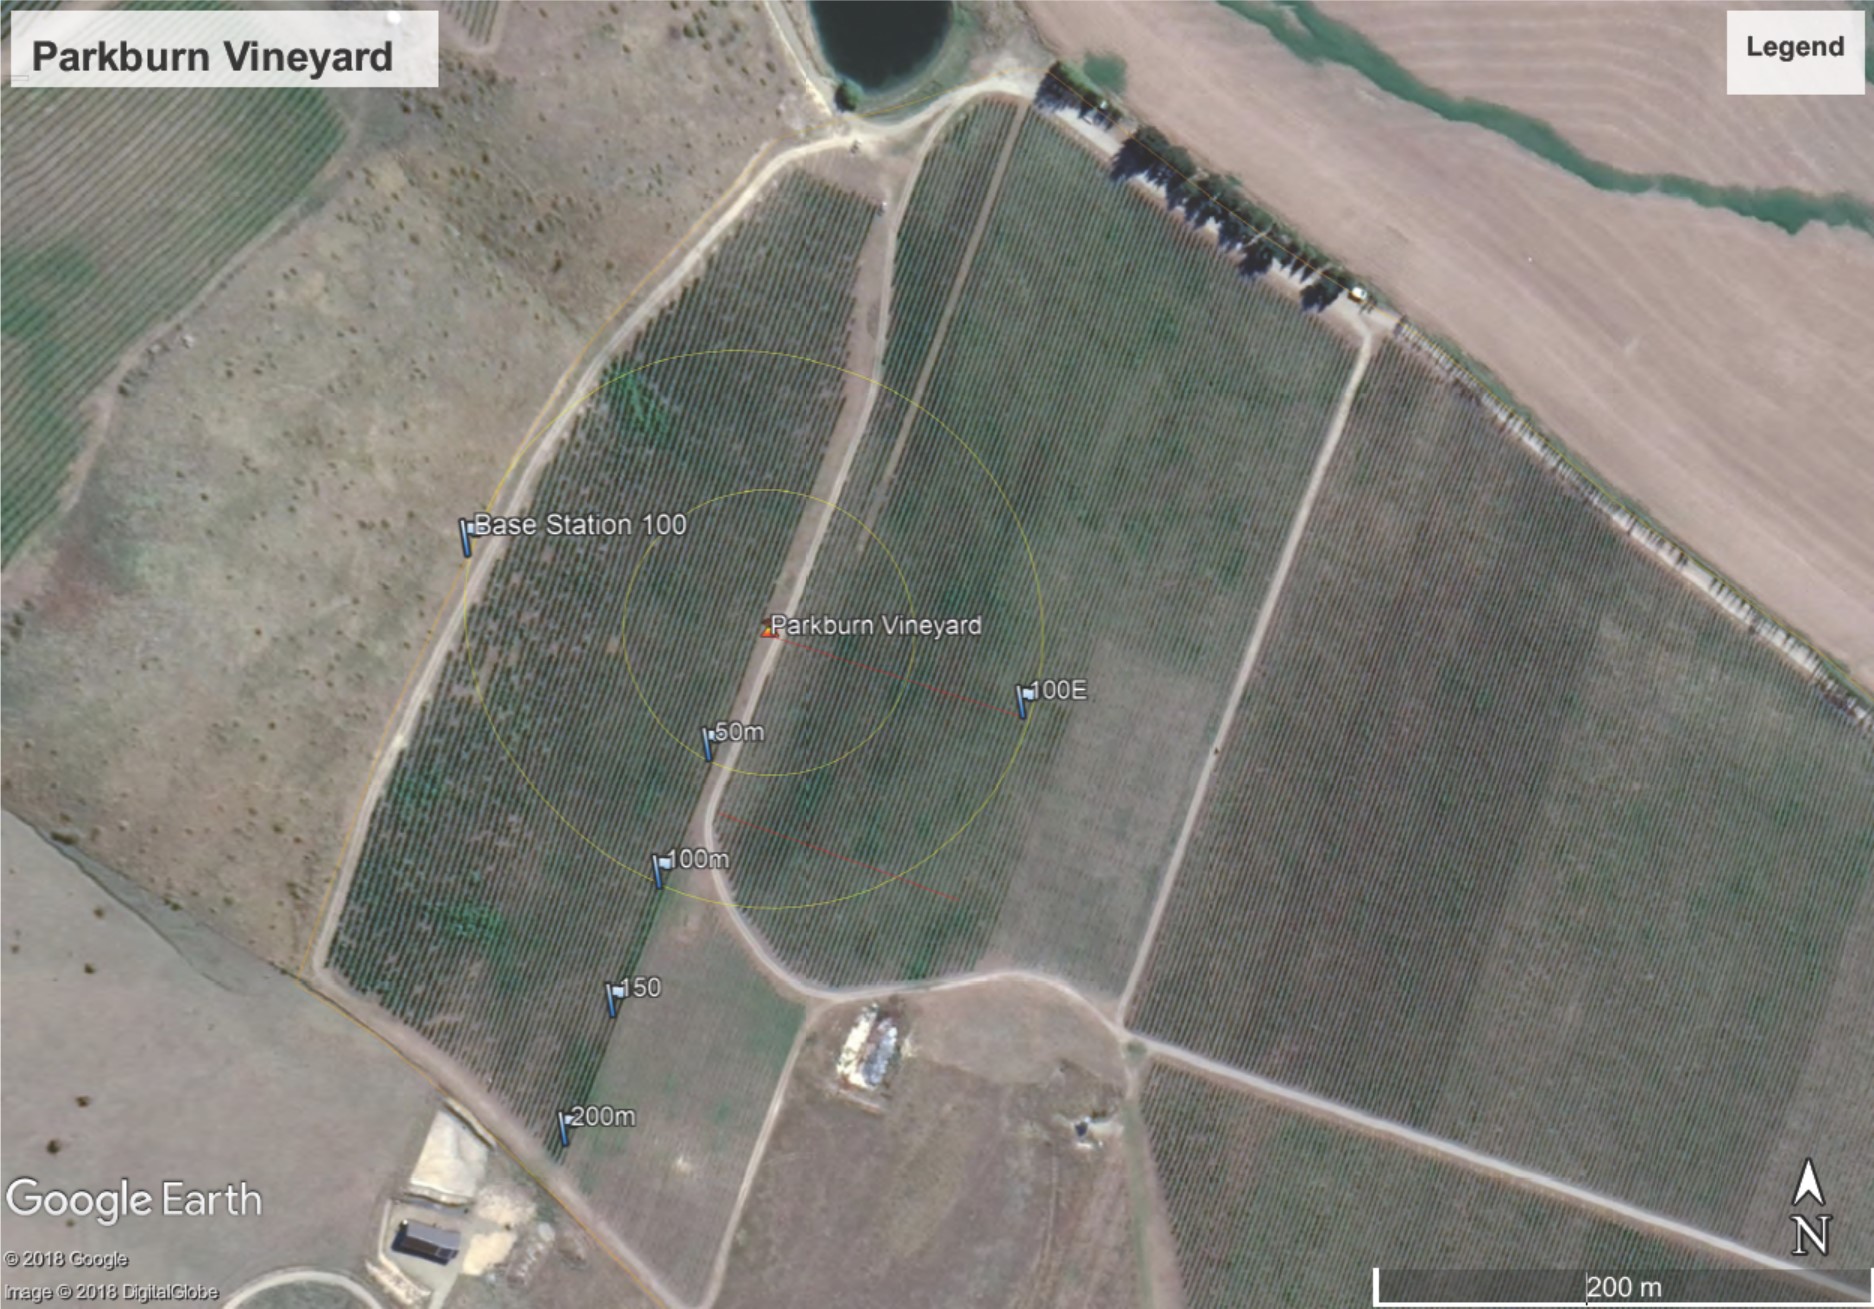
The graphs from the event and the layout of the block and machine location are shown. The site is interesting and Max and Brett’s experience was invaluable as they knew that the cold comes in from the south end and this cold influence moves north and east across the terrace towards the lake. The Parkburn vineyard is regarded as being 1°C – 2°C warmer than the lower terrace. The western slope is also generally warmer and we dispensed with the 100mW site.
During the morning of the 28th September the temps declined but were quite variable and differed significantly within the vineyard. This is partly because of the low pockets as can be seen by the temperatures recorded at mast 100mS which is in a depression, while the 150mS mast maintained better temperatures.
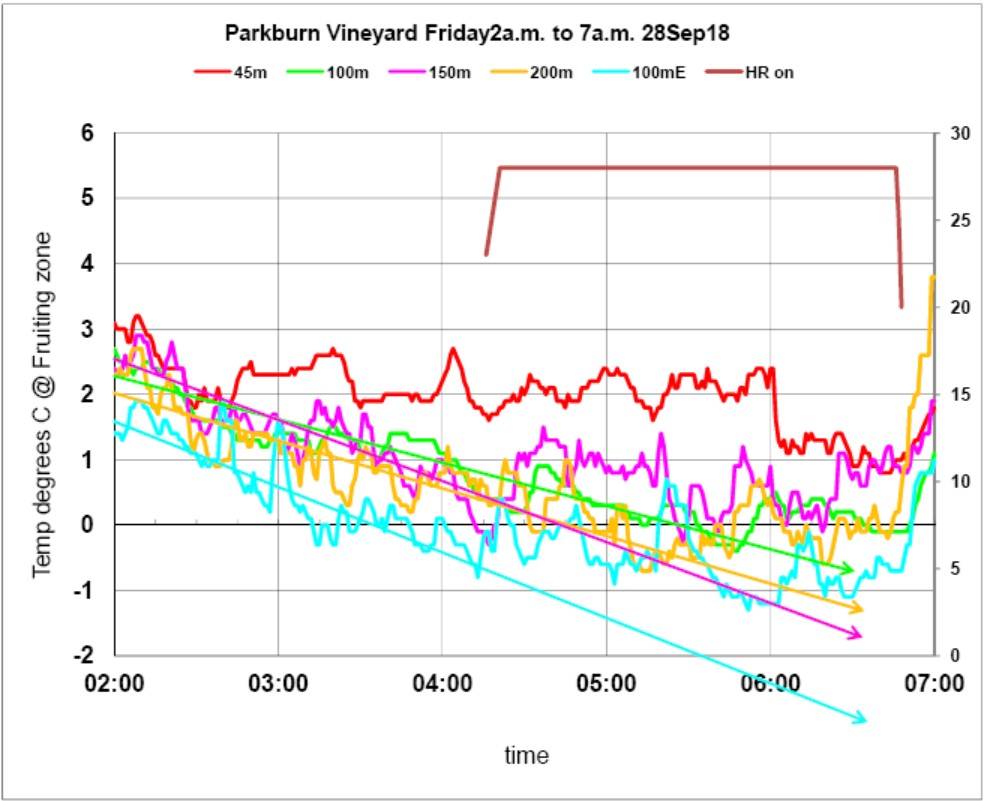
In order to assess the impact of the HR, the period from 2:00a.m to 4:15a.m. was used to generate a trend line for each site and this has been extended out to 6:30a.m. By definition the trend line runs through the middle of each data set with approximately half the data points on each side of the line. When the Heat Ranger turned on, all of the sites showed a significant increase over the next 6 minutes, bearing in mind that it has a three minute rotation interval. After that there were a number of ups and downs with very little time spent below the trend line and even the coldest area only had a few minutes below ‐1°C.
The 150mS mast had a significant drop at 5:20a.m. while mast 45mS had a significant drop at 6:00a.m. We do not have an explanation for this as we have no wind data. At about 6:40a.m. it appears to have reached the coldest period and the sun then took over. The trend line comparison needs to be regarded with caution because it is based on the assumption that the temp decline on average is reasonably uniform. This is only likely if there is no significant change in the cloud cover or wind. In this instance the overhead conditions were clear and there was no cloud cover, so the differences can reasonably be attributed to the input from HR. The Trend lines compared with the actual temps from 4:15a.m., when the machine was turned on, are an average of where the predicted temps would have gone over the next three hours if the Heat Ranger had not been running. The Heat Ranger has kept all temperatures above -1oC, apart from 100mE for a few minutes where it got down to -1.2oC.
This would appear to be a pretty good result.
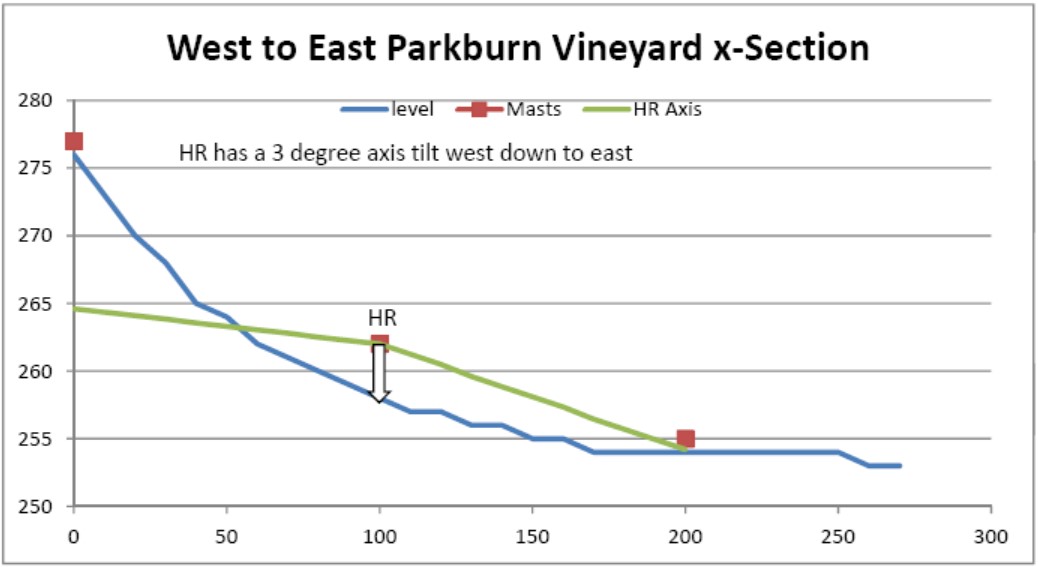
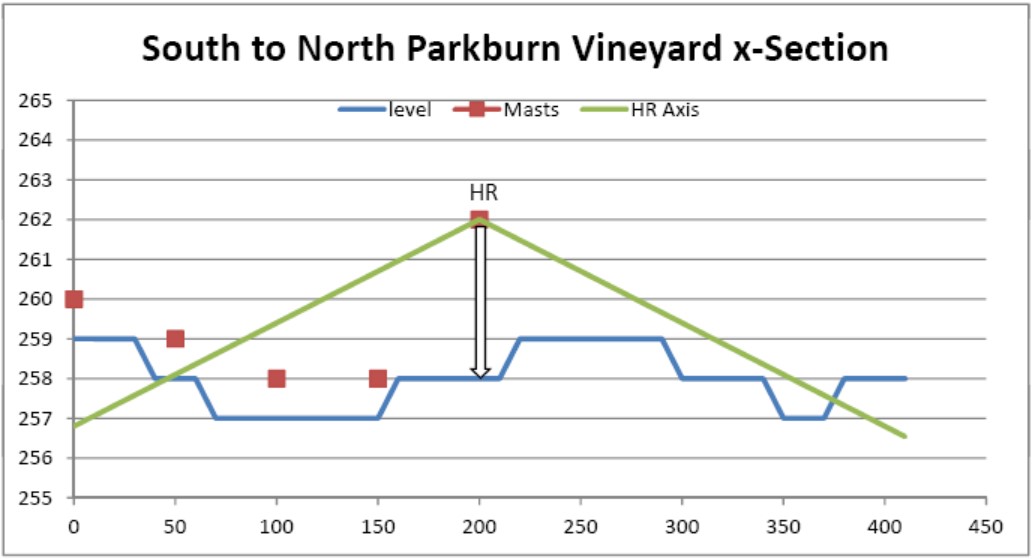
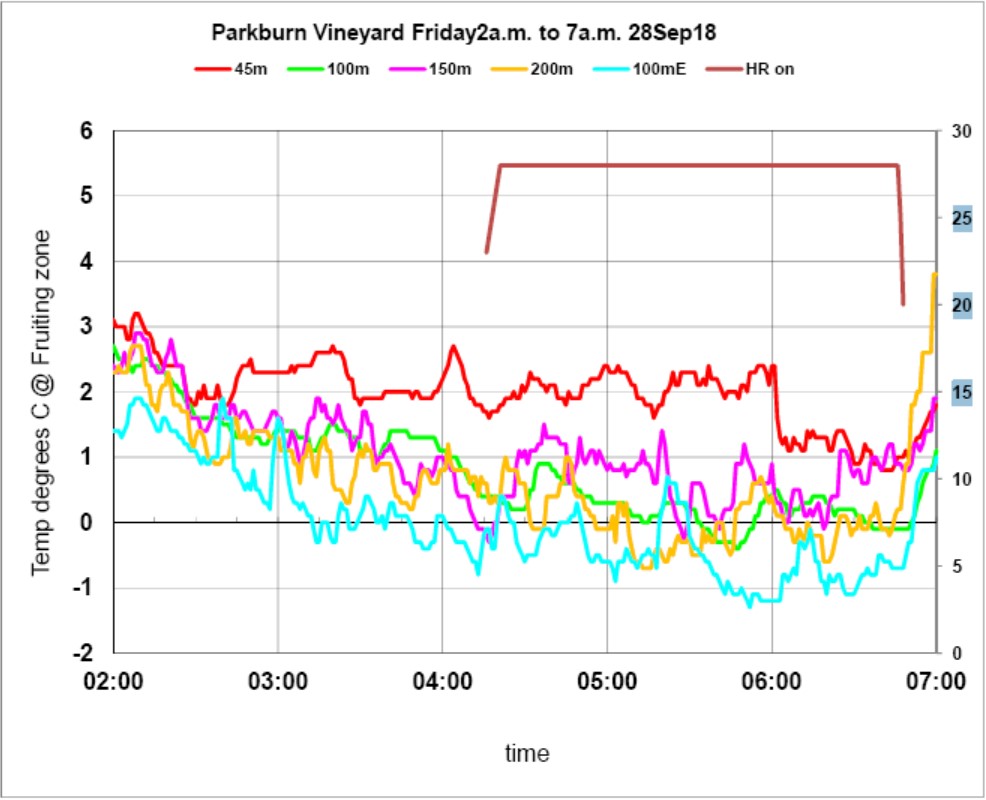
The Heat Ranger Nozzle has an inbuilt 1.5 degree angle toward the ground and is shown by the green lines in the lower chart. The angle looks very pronounced because of the relative scales of the two axis.
The Red squares represent the lower temp sensors on each mast.
On the top chart the zero distance is the location of the Base station up the hill 100m from HR and the 200m distance is the East Mast 100m from HR going downhill.
The green lines show the resultant angle with HR tilted 3°C and incorporates the additional 1.5 degree nozzle angle. The topography at the zero point is quite challenging and there is huge natural variability at this sensor which I can only assume is because of its steepness and elevation so that is collects any breeze that might drift along the escarpment.
The station at 100mWest has been omitted because of its variability. The coldest locations are Mast 200m where the cold air enters the vineyard from the South and the lower part of the vineyard at 100mE. Heat Ranger was started at 4:16a.m.
Results – 13th October 2018
On the 13th October Parkburn vineyard along with many others in the Cromwell area had a severe frost event and we had Heat Ranger set up in the coldest area of the vineyard to test its performance.
We also had a reference temperature sensor (base) in the North East part of the vineyard 560m from the Heat Ranger Machine so that we could draw some comparisons, however the variability of temperatures across the block make comparisons difficult and the fact that the locations do not trend uniformly makes it even more difficult.
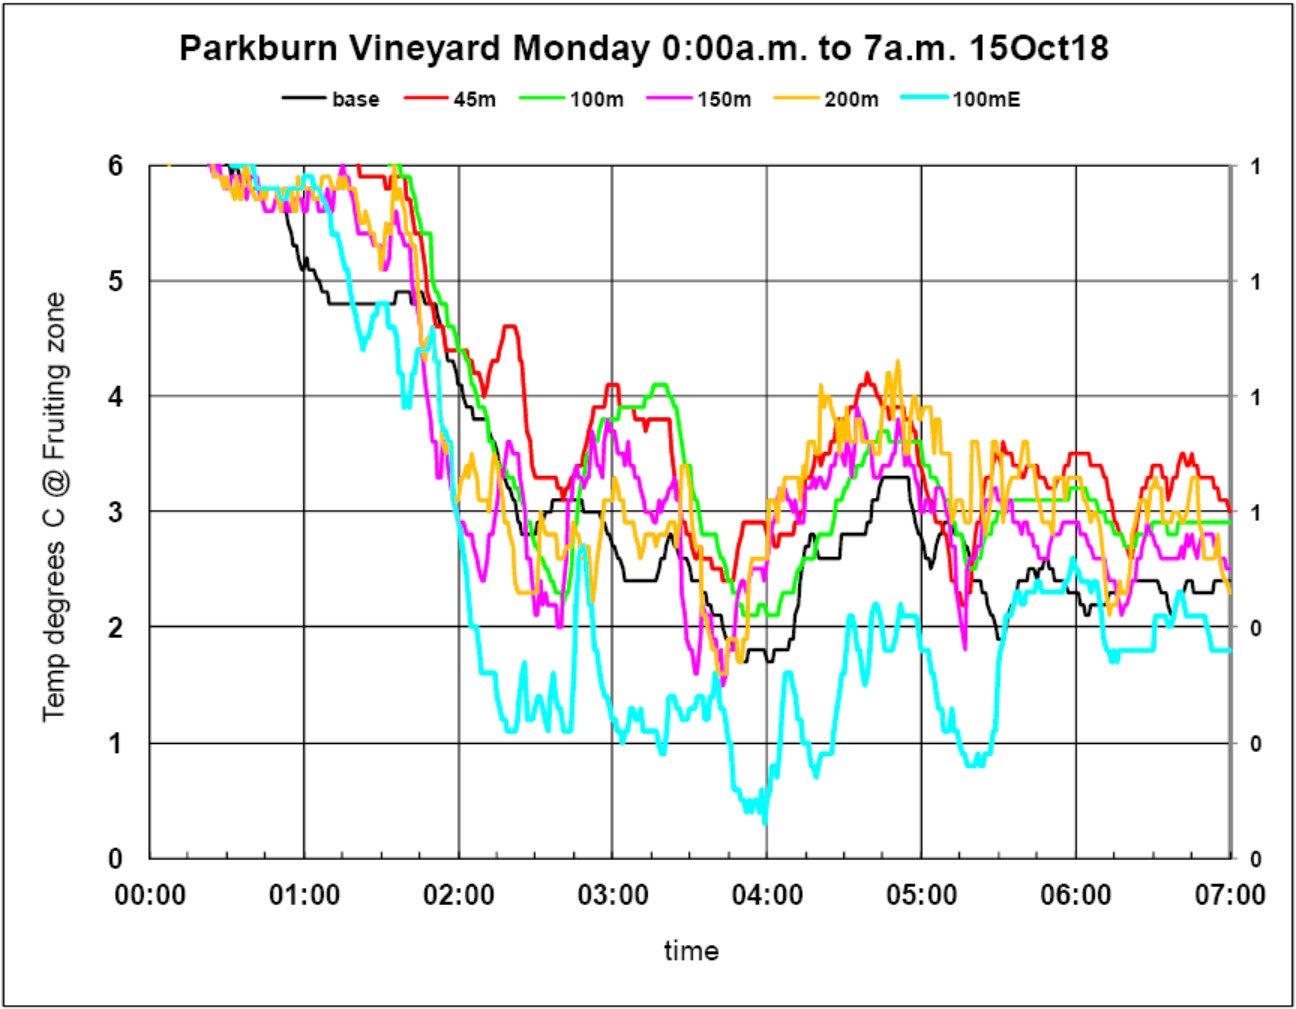
The temperature variability across the Parkburn site is quite large and bearing in mind that we are measuring temperatures at just 6 locations within a 15ha block with varying slopes that should not be a surprise.
When we have the warmest measure below +2°C we can get variability of up to 3°C between locations at the same point in time and we can get a single site drop by as much as 6°C in an hour and go back up 2°C ‐ 3°C within another half hour.
The trace on the 15 October for the sensors at cordon height illustrates the point when Heat Ranger was not turned on.
Chart 1 ‐ 15th October natural temperature variation at sensors 650mm above ground level.
The most significant frost occurred on the morning of the 13 October with a significant number of buds having broken into leaf. The Heat Ranger started at 1:10a.m. and ran through to 2:20a.m. with a nozzle air temperature of 30oC. The engine exhaust which is normally ducted to keep the gas bottles warm, had come partly adrift and was only providing an estimated 30% of the exhaust heat to the bottle pallets, which meant that the vaporising gas in the bottles were cooling at a faster rate than they were heating and this slowed the gas supply to the burner resulting in a decline in gas supply to the burner and resultant lowering of the nozzle air temperatures. From 2:20 until 2:55 the nozzle temp dropped down to 12°C and the burner shut off. (see the brown lines on chart 2)
It then goes through a restart cycle which takes about 3 ‐ 4 minutes which allows some gas to vaporise and the burner reignites. From 3:00a.m. this cycle of gas being on then off and then on again continued with the engine providing enough heat to vaporize small lots of gas to keep the burner going for a few minutes with a low flame that was enough to get up to 10°C ‐ 12°C.
The engine is not affected by this, as it uses liquid gas, so the normal fan and turret operation continued with a cooler air flow. By 4:00a.m. the 15 minute average nozzle air temperature was between 5°C and 7°C which was enough to take the edge off the frost until 5:45 and then temperatures really dropped between 6:00 to 7:30.The 200m temperatures got down below ‐3o for a bit over 30 minutes and suffered frost damage, but the rest of the buds came through relatively unscathed.
Chart 2 shows the 1 minute temperatures
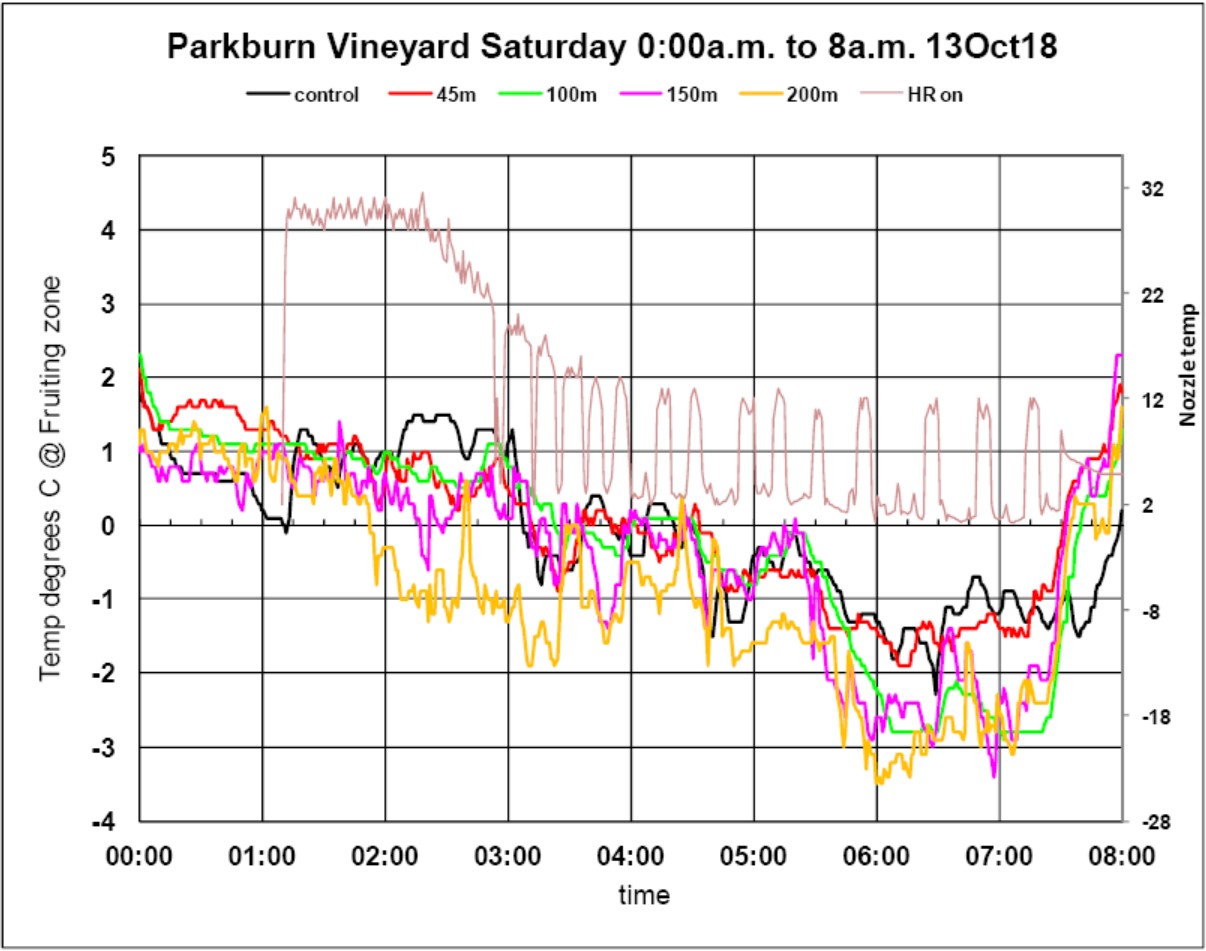
The brown chart line shows the nozzle temperatures against the secondary axis and the lack of exhaust heat on the bottles is clearly evident. Despite this the machine protected the young vine shoots out to the 150m mark where there was no damage and some damage out at 200m.
If the temperatures are plotted on a 15 minute rolling average the trends are a lot easier to see. Chart 3 ‐
15 minute rolling average temperatures at cordon height.
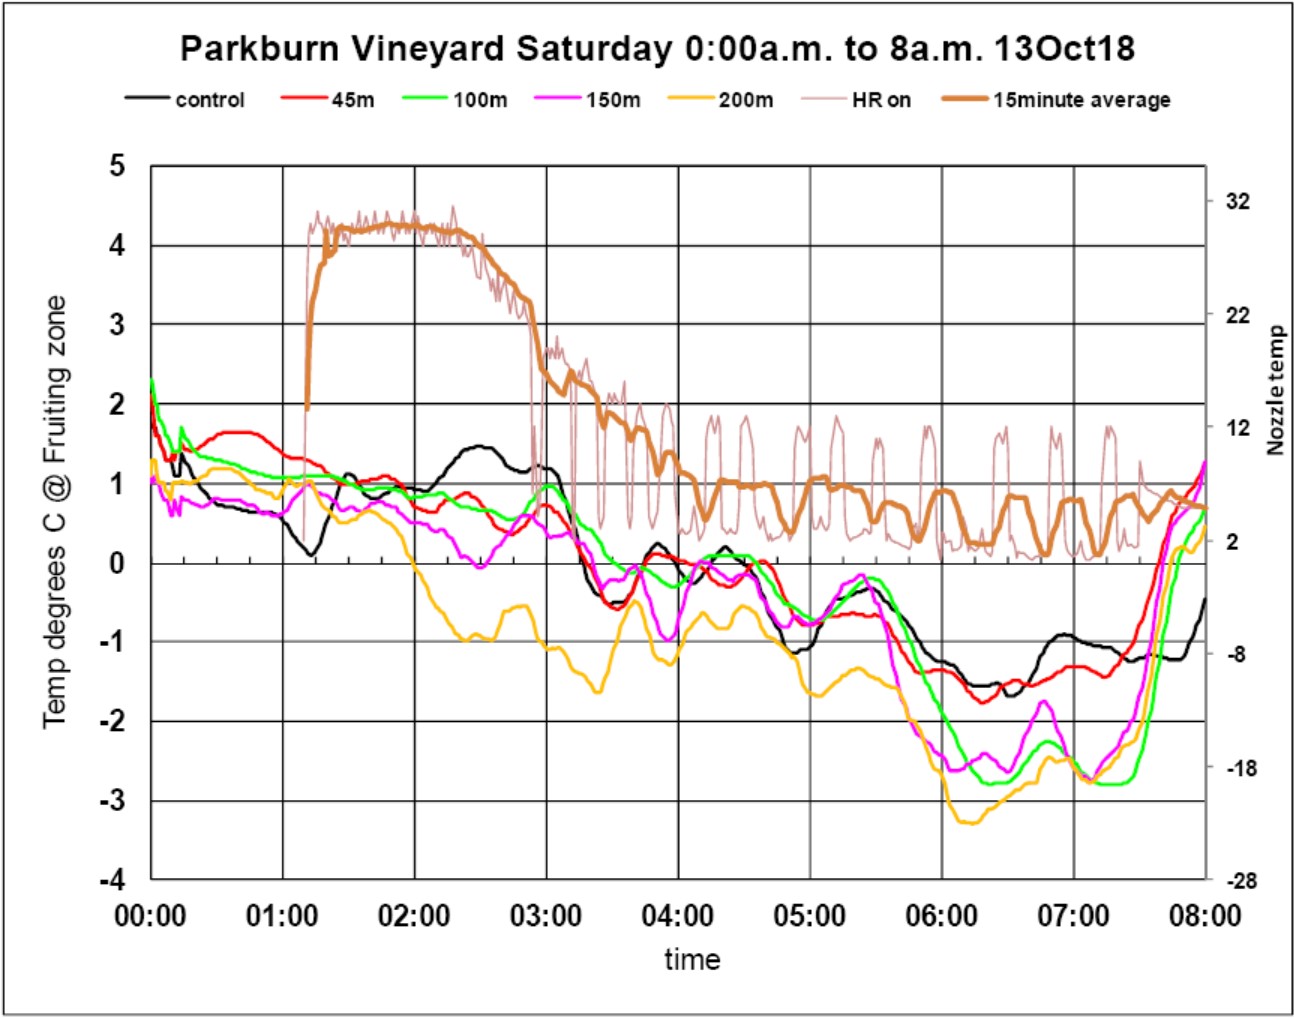
Had the heat input component been maintained at 30oC this would certainly have provided full protection out beyond the 200m mark. This is consistent with the vineyard protection achieved at Waipara on the 5th November 2015. The 200m site and the 100m site are the traditional cold areas on this block with cool air entering the vineyard at the 200m mast location.
In the Waipara event our measurements indicated that we are getting a sustained 2°C to 3°C lift in temperatures out to about 120m (4.5ha) and 2°C at 160m (8ha)and more than 1°C at 200m plus (12ha). On the site we have had protection out to the north east corner which is 360m this was helped by the adjoining shelter belt.
There are not many serious frost events during the spring period, but with each event that we operate, it reinforces the effectiveness of the machine as evidenced from post event photographs of the crop saved.
Chart 4 Temperature measurements at cordon height 5th November 2015 at Waipara
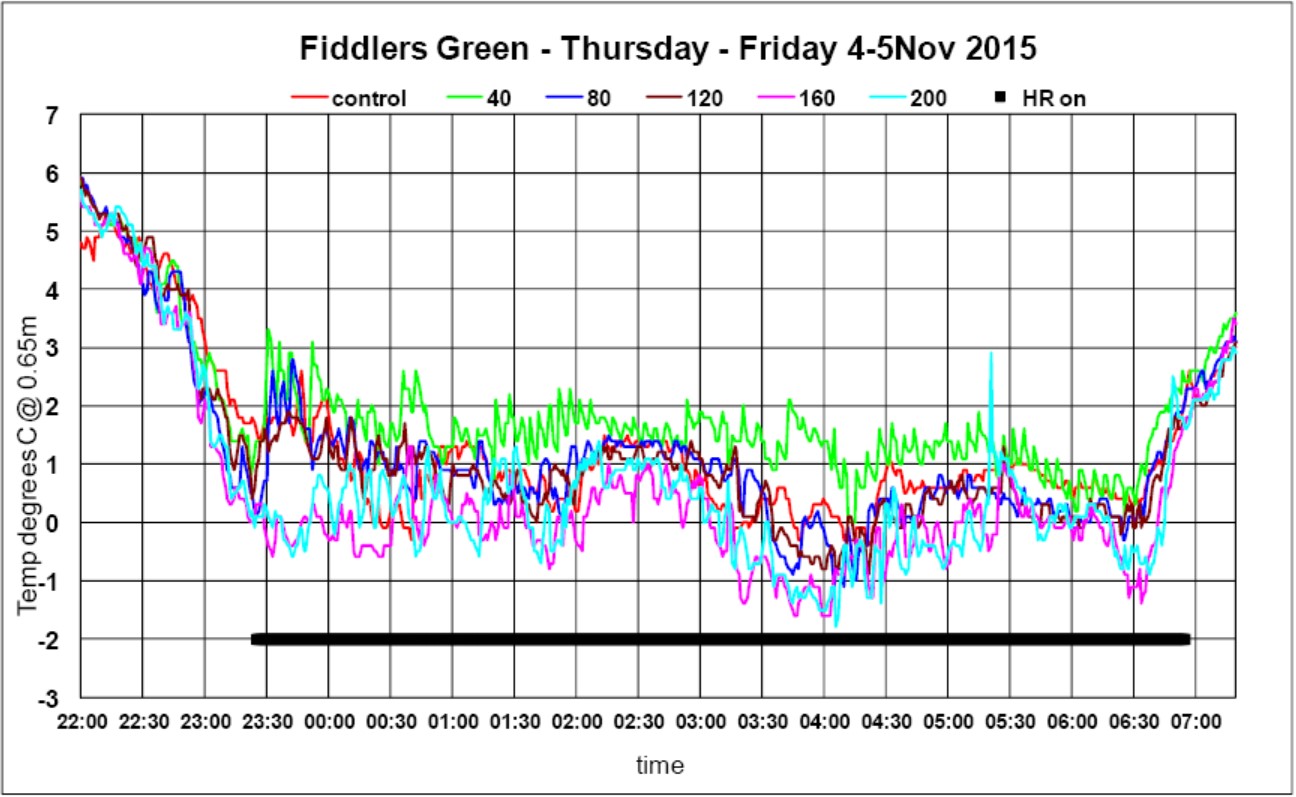
When you look at the vines a few days after the event the results are quite compelling. While in each of these events we have measured temperatures close to ‐2oC there was no crop damage. At Parkburn where we had temperatures at the 200m mark dip below ‐3oC for 30 minutes we did get some damage.
The picture of the vines from Fiddlers green below were taken 10 days after the event and no damage was seen out to 300m.
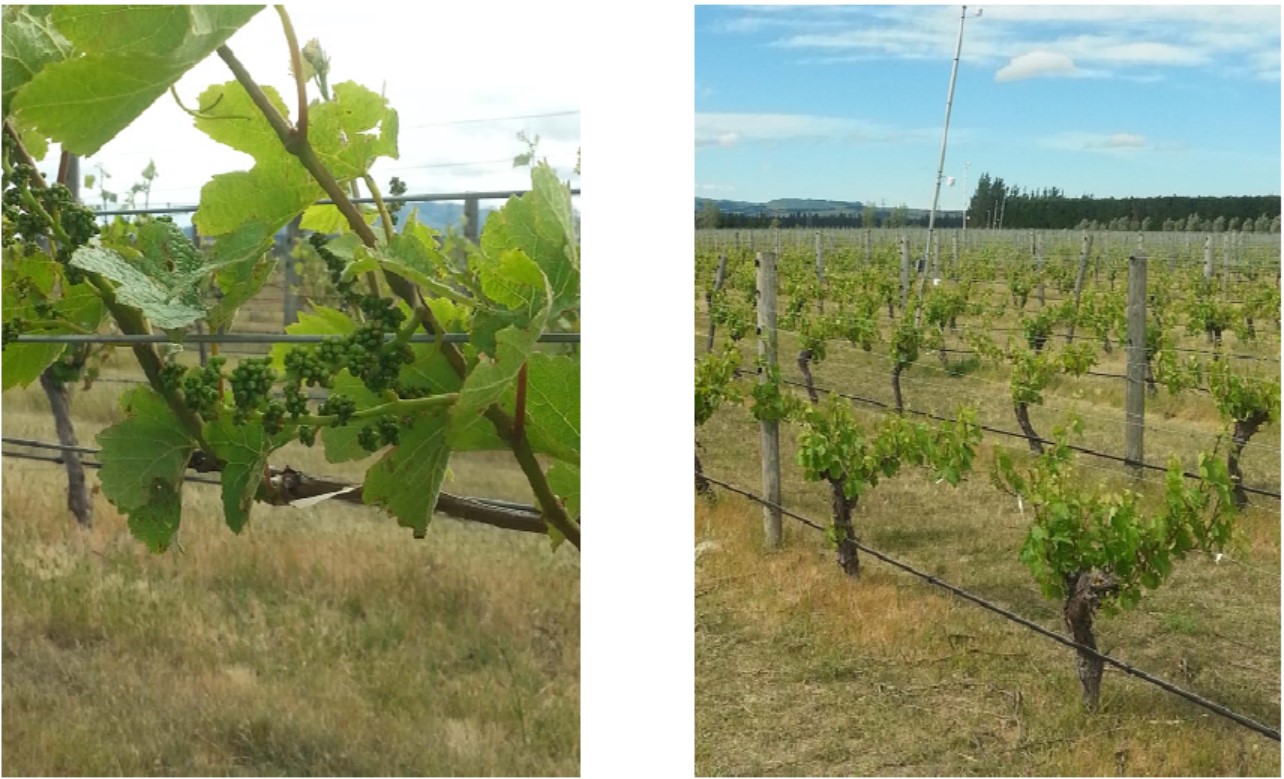
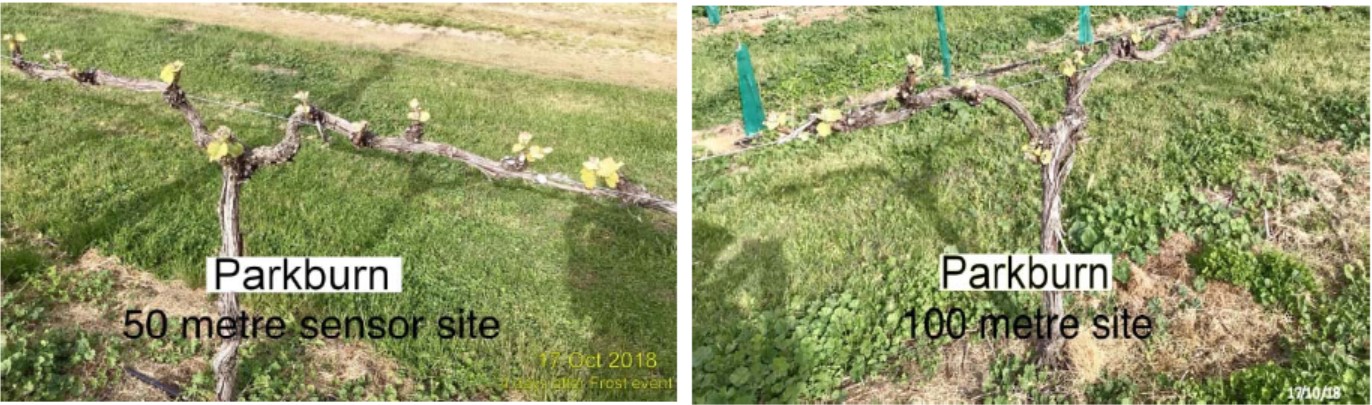
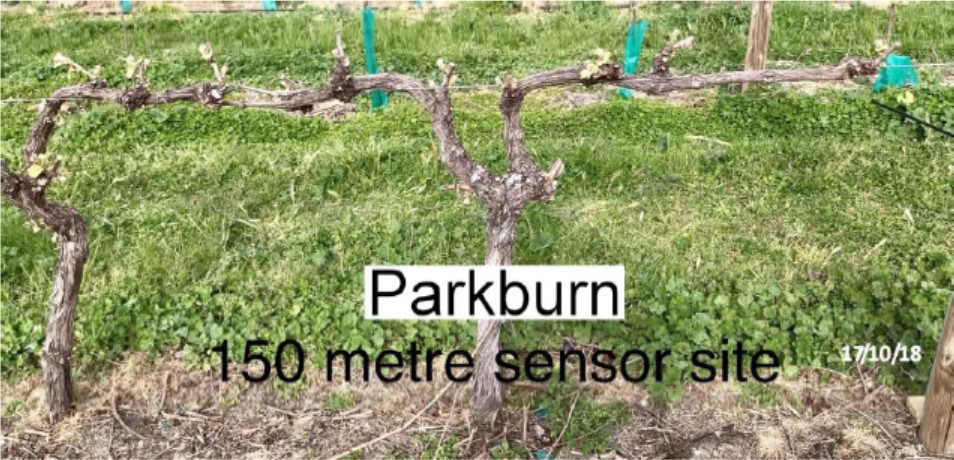
At Parkburn the pictures taken 4 days after the event, show a similar story albeit earlier in the season. There was no damage out to 150m from the Heat Ranger as seen in the first three photos.
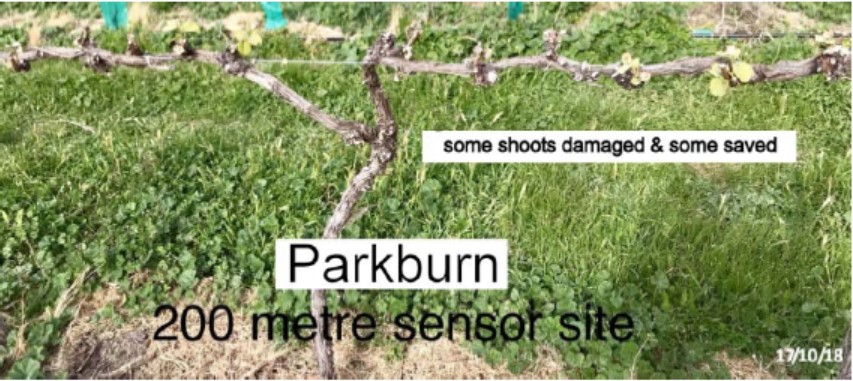
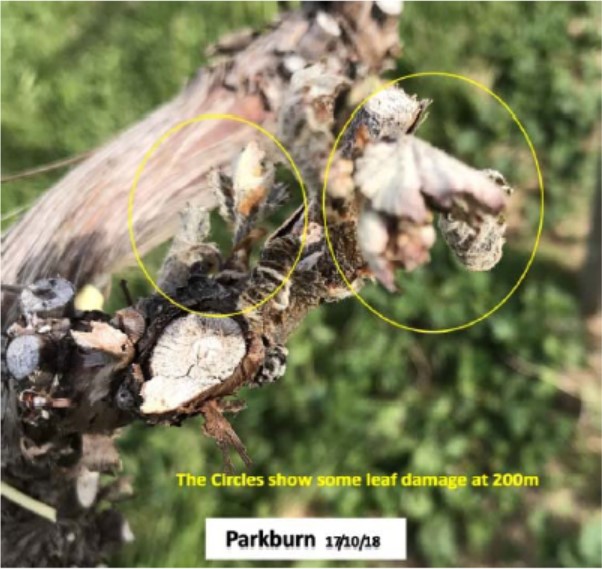
At 200m there is some damage but at least half the shoots appear free of damage. At this stage of the season you can expect new buds still to
open.
This result is exceptional given that the machine was operating with minimal heat at the coldest part of the frost.
Frost damage occurs when plant cells freeze and it is likely to be a combination of factors including the increase in temperature and the warm air blanket preventing this.